EMC Explorer User Guide
Introduction
The EMC Explorer is an interactive command-line tool for exploring, visualizing, and exporting Earth model data from NetCDF files. It supports:
- Metadata inspection
- 2D surface plotting
- Depth slices
- Cross-sections
- Geographic map rendering
- Data export in NetCDF, CSV, and GeoCSV formats
1. Quick Start
# Download a netCDF file from the EMC File Repository (for example CSEM2-Africa.v2024.12.01.r0.0-n4c.nc)
https://data.dev.earthscope.org/archive/seismology/products/emc/netcdf/CSEM2-Africa.v2024.12.01.r0.0-n4c.nc

# Run the tool
python src/emc_explorer.py -i CSEM2-Africa.v2024.12.01.r0.0-n4c.nc
You will see an interactive menu where you can choose tools and actions.
2. Navigation Basics
At each step, you will be prompted with available actions.
# Some tips for easier navigation.
[TIP] Type 'h' for hints at any prompt.
[TIP] Press Enter to accept default values (if provided)

# The first meu you will see.
[data] select option [meta, range, subset, map, help, exit | h]?

# Type "h" in response to get some hints about the menu items.
Hints
-----
  exit       Quit the tool
  help       Print usage text
  map        Show coverage map (if lat/lon available) <------ 2.1
  meta       View global attributes, coords, and variables <------ 2.2
  range      Show min/max for coords and variables <------ 2.3
  subset     Enter sub-menu: volume/slice/xsection/surface <------ 3
[data] select option [meta, range, subset, map, help, exit | h]?
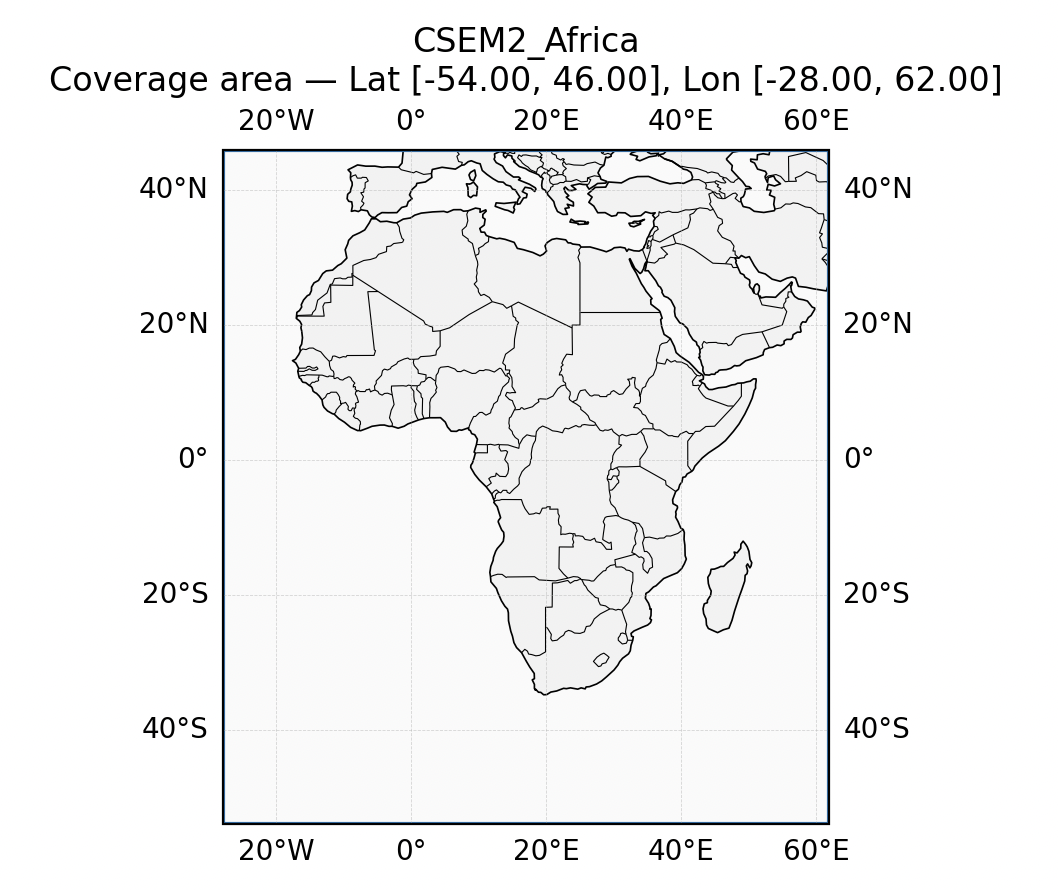
2.1 Display Map of Coverage Area (map)
[data] select option [meta, range, subset, map, help, exit | h]? map
2.2 Metadata Inspection (meta)
Lists dataset-level attributes and variable metadata.
[data] select option [meta, range, subset, map, help, exit | h]? meta

========================================================================
Metadata (3D)
========================================================================

Global attributes (geospatial*)
-------------------------------
  • geospatial_lat_units: degrees_north
  • geospatial_lat_resolution: 2.0
  • geospatial_lon_units: degrees_east
  • geospatial_lon_resolution: 2.0
  • geospatial_vertical_units: km
  • geospatial_vertical_positive: down
  • geospatial_lat_min: -54.0
  • geospatial_lat_max: 46.0
  • geospatial_lon_min: -28.0
  • geospatial_lon_max: 62.0
  • geospatial_vertical_min: 0
  • geospatial_vertical_max: 1200

Coordinate Variables
--------------------
  depth:
  ...
2.3 Range Inspection (range)
Show min/max for coords and variables.
[data] select option [meta, range, subset, map, help, exit | h]? range

========================================================================
Ranges (3D)
========================================================================

Coordinate Variables
--------------------
  • depth: 0.00 to 1200.00 kilometers
  • latitude: -54.00 to 46.00 degrees_north
  • longitude: -28.00 to 62.00 degrees_east

Data Variables
--------------
  • VSV: 2.44 to 6.62 km/s
  • VSH: 2.64 to 6.63 km/s
  • VPV: 4.76 to 11.93 km/s
  • VPH: 4.76 to 11.93 km/s
  • RHO: 2024.27 to 4694.88 kg/m^3
3. Tool Reference (subset)
[subset] select [volume, slice, xsection, back, exit | h]?

  back       Return to main menu
  exit       Quit the tool
  slice      Slice along one coordinate (e.g., depth)  <------ 3.1
  volume     Extract a subvolume (limits for each dimension)
  xsection   Interpolated vertical cross-section along a path  <------ 3.2

[subset] select [volume, slice, xsection, back, exit | h]?
back Return to main menu
exit Quit the tool
slice Slice along one coordinate (e.g., depth) <------ 3.1
volume Extract a subvolume (limits for each dimension)
xsection Interpolated vertical cross-section along a path <------ 3.2
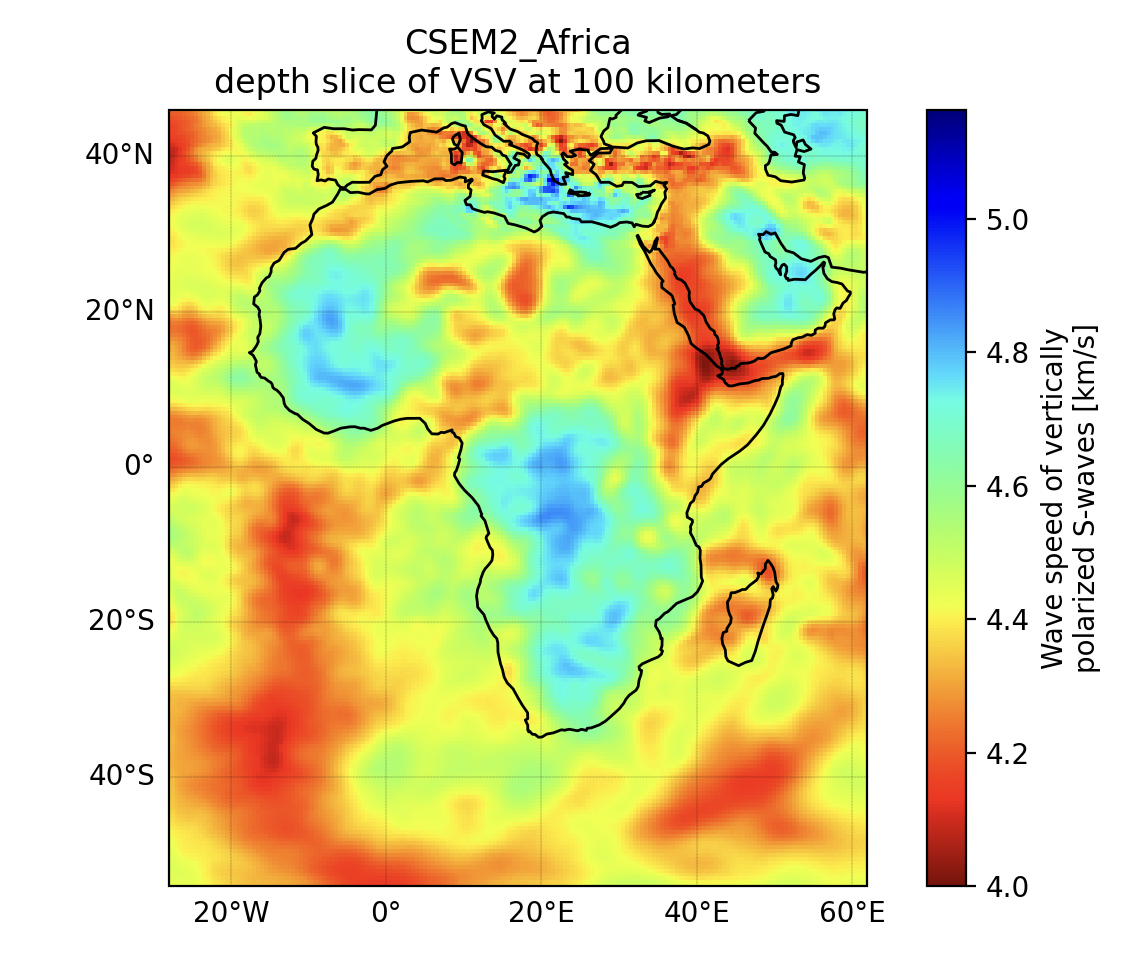
3.1 Depth Slice (slice-depth)
Plots slices at a given depth (here 100) for 3D variables.
Example:
[slice-depth] value (back/exit)? 100
[TIP] latitude valid range = [-54, 46] (Enter 'min,max' or blank for full)
[slice-depth] latitude limits (back/exit)? <------ press Enter fro full range
[TIP] longitude valid range = [-28, 62] (Enter 'min,max' or blank for full)
[slice-depth] longitude limits (back/exit)? <------ press Enter fro full range
Actions available:
- plot2d – Depth slice plot
- plot3d – 3D rendering
- gmap – Geographic overlay <------
- cmap – Change colormap
- save – Save the slice
[slice-depth] Action [plot2d, plot3d, gmap, cmap, save, back, exit | h]? gmap
[slice-depth] variable ['VSV', 'VSH', 'VS', ...] (back/exit)? VSV
Depth Slice gmap:
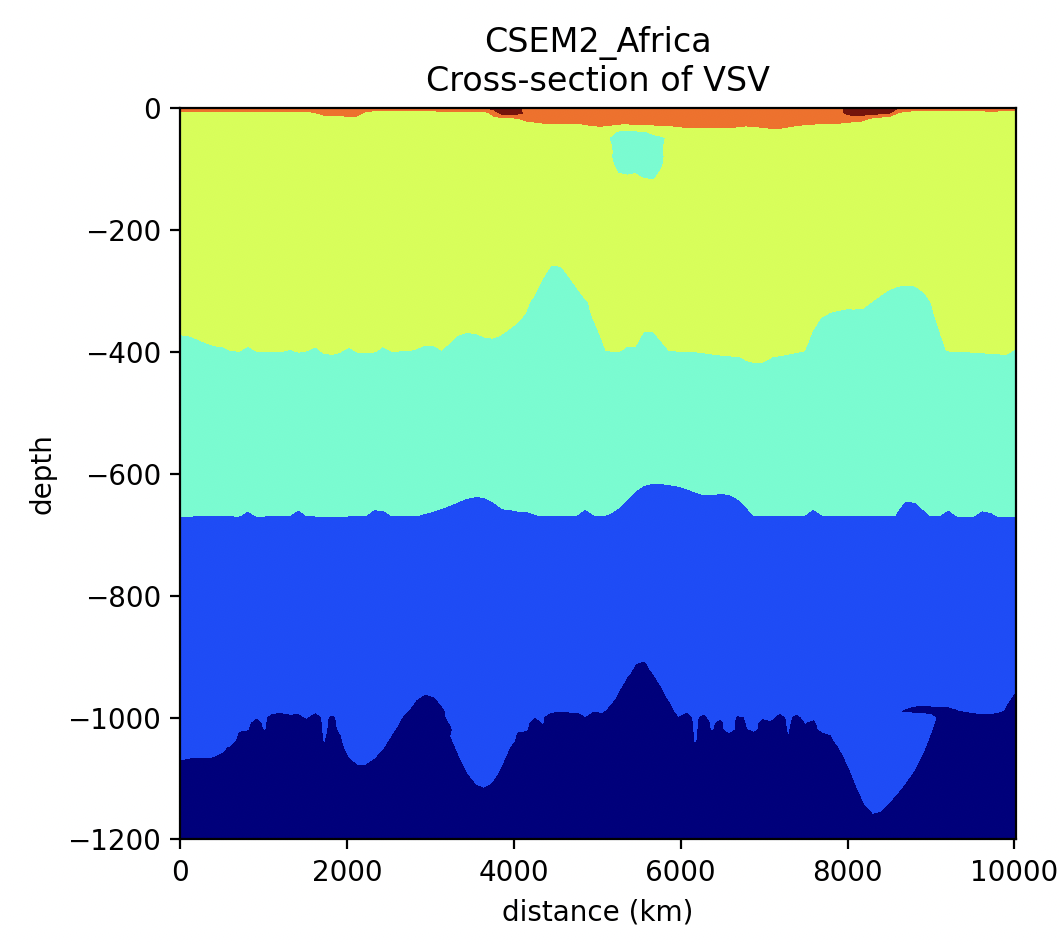
3.2 Cross-Section (xsection)
Plots data along a transect between two points.
Steps: 1. Select a variable. 2. Enter start and end coordinates. 3. Set cross-section width. 4. Choose plotting method.
xsection:
4. Saving Data (save)
When using save, you will be prompted for:
- Output format (NetCDF, CSV, GeoCSV)
- Output filename
Only the currently selected variable subset will be saved.
Example:
[save] filename,type (e.g., out,netcdf | back/exit, h)? test,netcdf
5. Changing Colormaps (cmap)
You can type list to see all available colormaps.
Example:
[cmap] name or 'name,vmin,vmax' (type 'list' to see available cmaps)? list
Available colormaps (170):
magma, inferno, plasma, viridis, ...
After listing, you will be prompted again to enter your choice.
Comments or Questions?
For any questions or feedback about EMC Earth models or EMC-Tools,
please email: help@earthscope.org